
COLLECTION OF CHARTS
Click on the chart to see it bigger!
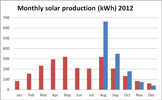 Monthly production 2012
 Monthly production 2013
The chart is showing a typical curve about how much energy photovoltaics are producing in summer (in blue), but how little solarpanels are producing in the same periode of time because of their vertical position. We have optimized them for winter, spring and autumn. In summer they don't get overheated - what is causing many people problems. We have even enough hot water in summer.
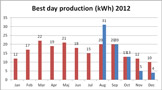 Best day production 2012
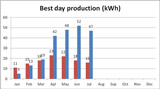 Best day production 2013
We are not checking anymore every day. Sometimes when you are not at home, therefor it is difficult having exact numbers.
 Self-sufficiency in power 2013
 Balance sales-buy in kWh 2013